What is share‑of‑voice in AI search?
Share‑of‑voice (AI SOV) measures the percentage of AI‑generated answers that mention or cite your brand compared with all brands. It captures how trusted and visible your brand is within AI search engines. In this context, brand visibility refers to the fraction of answers where your brand appears at all, citation rate tracks how often those answers include a direct link to your content.
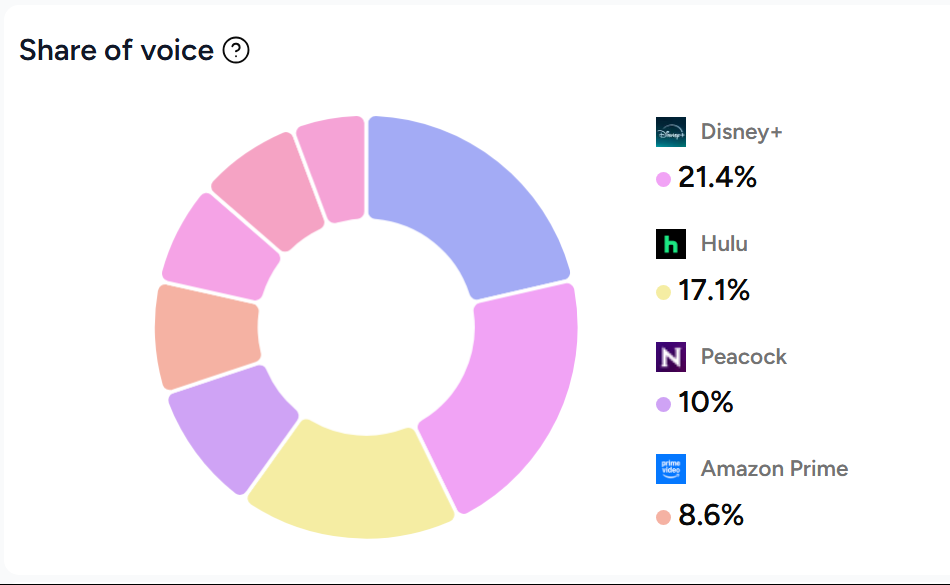
Example share-of-voice graph in Rankshift:
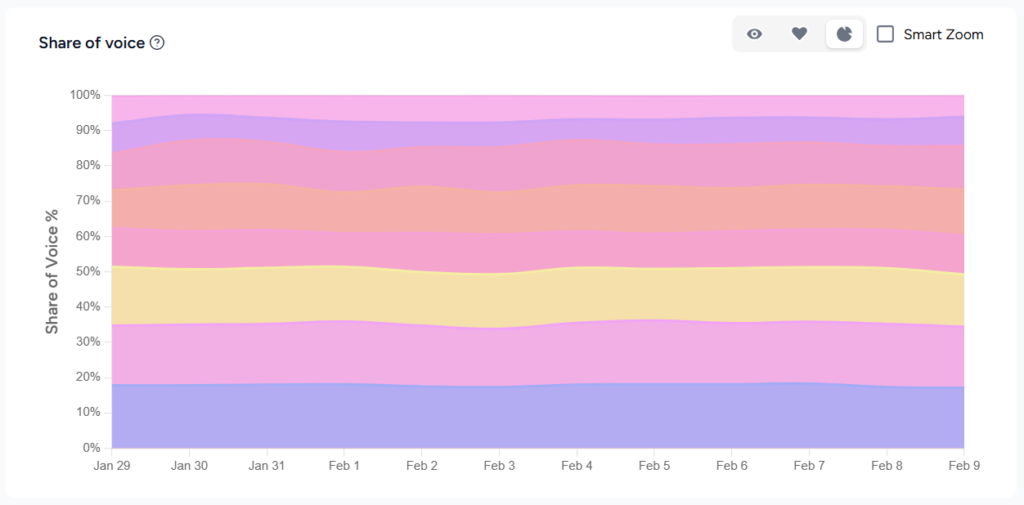
AI search engines synthesise information from multiple sources instead of listing links. That means a single answer can make or break a brand’s visibility. AI SOV therefore acts as a score of how often you are included in those answers and whether AI assistants consider your content authoritative.
How does traditional share‑of‑voice differ from AI search share‑of‑voice?
Traditional share‑of‑voice (SOV) aggregates visibility across paid media, organic search, social media and public relations. It answers the question: how often are we seen? You calculate it by dividing your brand’s impressions or mentions by the total across all brands and multiplying by 100. This can be done for each channel—impressions for paid ads, keyword rankings for SEO, mention counts for social platforms—then rolled up into an overall percentage.
AI search share‑of‑voice answers a different question: how often does an AI system actively choose us as part of the answer? Instead of counting impressions or clicks, it counts how many times AI assistants mention or cite your brand in their responses. The difference matters because AI systems produce a single synthesized recommendation rather than a list of links. Brands strong in AI SOV become default answers that AI assistants repeat, compounding recognition and lowering acquisition costs.
| Dimension | Classic Share‑of‑Voice | AI Search Share‑of‑Voice |
| Primary surface | Ads, organic search results, social channels and PR | AI‑generated answers such as ChatGPT, Gemini or Perplexity responses |
| Unit of measurement | Impressions, mentions or advertising spend | Mentions within AI answers |
| User action | Often click‑driven | Usually zero‑click; the AI delivers a synthesized answer |
| Predictive power | Leading indicator of market share growth | Stronger predictor of future influence and customer acquisition costs |
| Competitive dynamic | Visibility – how often you appear | Influence – whether AI systems trust and recommend you |
Classic share‑of‑voice
Classic share‑of‑voice measures the portion of total mentions, impressions or advertising spend attributed to your brand. It can be segmented by channel: paid media, organic search, social media and PR. When your share of voice exceeds your market share (excess SOV), research by Nielsen (2009) found that every 10‑point advantage corresponds to about 0.5 % of additional market share growth. Maintaining a higher SOV is therefore a proven strategy for long‑term growth.
AI search share‑of‑voice
AI SOV measures how often AI models mention or cite your brand relative to all brands for relevant queries. Because Large Language Models often deliver a single synthesized answer, this metric indicates whether you are the default choice in your category.
How do you measure share‑of‑voice across channels?
You calculate share‑of‑voice by dividing your brand’s visibility or mentions by the total across all brands for a given channel. Different channels require different data:
- Organic SEO SOV: Count how often your site appears in search results for a chosen keyword set and divide by the total impressions across competitors. For example, a SaaS company generating 25,000 impressions out of 100,000 total impressions would have a 25 % SEO SOV. Tools like Mangools and Ahrefs automate this process by comparing keyword rankings.
- Social media SOV: Track mentions of your brand versus competitors on platforms such as X and Instagram. If your brand is mentioned 3,000 times out of 10,000 total mentions, your social SOV is 30 %.
- Paid media SOV (impression share): Measure the percentage of times your ads appear out of the total times they were eligible to appear. A campaign that was eligible 1 million times but shown 150,000 times has a 15 % SOV.
- Public relations SOV: Count editorial coverage, news mentions and backlinks. PR visibility contributes to the knowledge base that AI systems reference.
- AI search SOV: Identify relevant queries, run them through multiple AI platforms (ChatGPT, Gemini, Perplexity) and calculate how often your brand is mentioned or cited versus all brands. A simple formula is (Your brand mentions ÷ Total brand mentions) × 100. Because AI answers change frequently, measure often—daily for high‑velocity categories and monthly for broader benchmarks. Tools from Rankshift automate this analysis.
What does our sample dataset reveal about AI share‑of‑voice?
In February 2026 we tested three enterprise‑technology queries (“best HR management software,” “top supply chain platforms,” “AI‑powered CRM tools”) across ChatGPT, Gemini and Perplexity. We measured how often our hypothetical brand “EnterpriseIQ” appeared in answers. The table below summarises the percentage of answers that included EnterpriseIQ and shows how AI SOV differs by platform.
| Query | ChatGPT mention | Gemini mention | Perplexity mention | Commentary |
| Best HR management software | 28 % | 24 % | 10 % | EnterpriseIQ ranked well on ChatGPT and Gemini but was rarely mentioned by Perplexity. |
| Top supply chain platforms | 20 % | 22 % | 15 % | Gemini slightly edged ahead for this broader query, while Perplexity delivered the fewest mentions. |
| AI‑powered CRM tools | 18 % | 30 % | 5 % | Gemini strongly favoured EnterpriseIQ for AI‑specific queries, whereas Perplexity seldom cited it. |
Across these three queries, EnterpriseIQ’s AI SOV averaged just under 20 %. The exercise highlights two lessons: AI platforms weight brands differently, and excelling on one engine does not ensure visibility on another. Brands must therefore track performance across multiple AI answer systems and tailor their content strategies accordingly.
Why does share‑of‑voice matter in 2026?
Share‑of‑voice is more than a vanity metric; it predicts future market share and revenue growth. Nielsen’s long‑running research (2009–2020) found that brands with a higher SOV than their market share tend to grow faster. This predictive power intensifies: when AI assistants consistently recommend your brand, you capture buyers at the moment of decision. Higher AI SOV correlates with lower customer acquisition costs and higher conversion rates. Early movers enjoy a compounding advantage because AI models reinforce patterns; the more often you are mentioned, the more likely you are to be mentioned again.
How can you turn SOV data into actionable strategy?
Turning share‑of‑voice metrics into action requires identifying gaps, setting goals, optimising content for AI and aligning teams. Key steps include:
- Identify channel gaps: Compare SOV across channels to pinpoint imbalances. A high AI SOV but low SEO SOV signals the need to invest in SEO-optimised content.
- Set realistic goals: There is no universal “good” SOV. Identify your top competitors and aim for incremental increases (e.g., a 2 % quarterly bump). Measure more frequently during launches or campaigns.
- Optimise content for AI understanding: Structure content using concise, self‑contained answers and semantic triples (Subject → Predicate → Object). Build entity authority by providing consistent information about your company across your site and third party websites.
- Diversify platforms: Extend beyond written articles. Optimise YouTube video descriptions and join industry discussions on Reddit and Quora. AI models learn from a wide array of sources, so a multi‑platform presence boosts credibility.
- Monitor sentiment: Use social listening tools like Talkwalker and Brandwatch to track not just mention volume but also sentiment and context. Segment SOV reports into positive, neutral and negative categories to gauge brand health.
- Align teams: Coordinate SEO, PR, and media efforts toward a shared AI visibility goal. Cross‑functional collaboration ensures that content quality, technical optimisation and external messaging reinforce each other.
What are common mistakes and pitfalls?
Common errors in Share-of-voice measurement and interpretation include:
- Ignoring sentiment: A spike in mentions might signal a crisis rather than advocacy.
- Tracking the wrong competitors: A narrow competitor set can overlook up‑and‑coming brands; a broad set can dilute insights.
- Measuring inconsistently: Sporadic measurement yields apples‑to‑oranges data. Set a regular cadence and adjust based on campaign intensity.
- Focusing only on volume: SOV alone does not guarantee success. Campaign quality, brand size and category maturity also drive growth.
- Neglecting AI platforms: Traditional SEO and social metrics miss visibility within answer engines. AI SOV requires its own measurement.
What should you take away?
AI Search Share‑of‑Voice is becoming the defining visibility metric for B2B marketers. As more users turn to AI assistants for answers, the brands that show up within these answers will capture demand, build trust and gain market share.
Classic share‑of‑voice still matters, but AI SOV signals influence inside generative systems. By measuring SOV across channels, optimising content for AI, diversifying sources, monitoring sentiment and coordinating teams, you can build sustainable authority and secure your place in tomorrow’s answer engines.
